
GFChart Gutenberg Add-On 1.0
Description
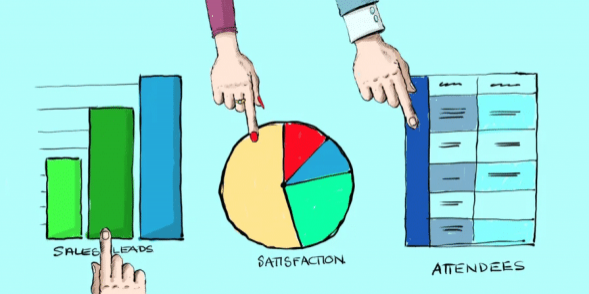
GFChart Gutenberg Add-On is a WordPress plugin that adds chart and dashboard elements directly inside the Gutenberg editor. It helps you translate complex datasets into readable visuals and actionable insights while you build posts, pages, and templates. Instead of switching between reporting tools and the editor, you can monitor performance signals like sales pipeline health, registrations, and survey results where content is created. The result is faster updates, clearer communication, and more consistent decision-making across your site.
Built for data-driven workflows, this add-on supports analytics-style views for lead validation, customer satisfaction, demographics and cohorts, event booking status, and operational reporting. Whether you’re preparing marketing pages, course overviews, or internal-style dashboards, GFChart keeps your insights close to your audience.
Main Features
- Sales pipeline health visuals — Track pipeline status and overall lead flow with chart-based reporting in Gutenberg.
- Lead needs and validation tracking — Monitor lead validation and quality assessment alongside survey responses.
- Registrations and course feedback views — Show registration activity and compare course feedback to inform improvements.
- Survey comparison and personality profiling — Compare interview feedback between locations and surface profile patterns.
- Customer satisfaction and staff feedback charts — Visualize satisfaction monitoring and track outcomes from staff exit surveys.
- Demographics, cohorts, and event metrics — Combine demographic insights with event booking status and RSVP counting.
- Operational and donor progress dashboards — Track fundraiser progress, branch activity, production monitoring, and dealer network performance.
Benefits
- Faster insight updates — Update charts in the Gutenberg workflow without leaving WordPress to find the latest numbers.
- Smarter follow-ups — Use pipeline and lead validation visuals to prioritize higher-quality actions.
- Clearer audience engagement — Publish dashboards that make registrations, events, and satisfaction trends easier to understand.
- Better reporting consistency — Keep operational, survey, and analytics views aligned across pages and template sections.
Who is it suitable for?
- WooCommerce stores and sales teams tracking leads and pipeline performance
- Course providers and online learning platforms monitoring registrations and feedback
- Membership sites sharing event, RSVP, and demographic insights
- Agencies building Elementor/Gutenberg pages with recurring analytics views
- Nonprofits and operations-heavy organizations tracking fundraising and branch activity
