Chartli 1.2.1 – WordPress Interactive Chart Plugin
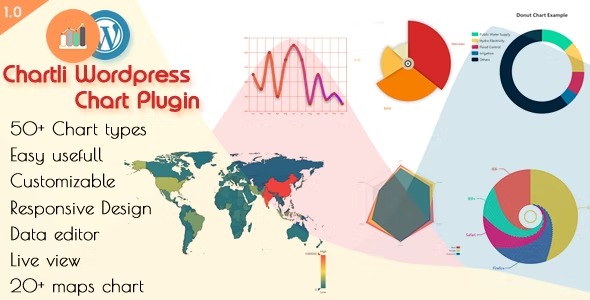
Chartli lets you create a wide variety of customizable graphics for WordPress, turning data into clear, engaging visuals. It delivers a main benefit of flexible, code-free charts that fit any theme. A major advantage is seamless integration and intuitive controls, inviting you to explore powerful visuals with ease.
Description
Chartli is an advanced WordPress chart plugin that helps you turn numbers and research into clear, engaging visuals. Instead of relying on code, you can build customizable graphics with intuitive, code-free controls. This makes it easier to present insights in a format that matches your WordPress theme and improves how readers understand data.
Whether you’re summarizing performance, comparing categories, or illustrating trends, Chartli supports a wide variety of chart styles so your site can stay visually consistent. With seamless integration into your WordPress content, you can focus on communicating your message while Chartli handles the chart output.
Main Features
- Code-free chart creation — Build charts without writing custom code.
- Highly customizable graphics — Adjust visual elements to fit your needs and design.
- Multiple chart types — Create a wide variety of chart styles for different data presentations.
- Theme-friendly styling — Keep charts consistent with your WordPress theme’s look and feel.
- Intuitive configuration controls — Fine-tune chart options with user-friendly settings.
- Seamless WordPress integration — Add charts directly into WordPress content where you need them.
- Clean, readable visualization — Present data in a way that’s easy to scan and understand.
- Flexible layout fit — Use chart visuals that work across common page contexts.
Benefits
- Better data clarity — Turns raw figures into visuals that improve comprehension.
- Higher engagement — Makes reports and updates more interesting to read.
- Consistent branding — Helps charts match your WordPress theme for a unified look.
- Faster content publishing — Code-free controls reduce time spent building visuals.
- Improved user experience — Clean chart layouts support quicker scanning and understanding.
Who is it suitable for?
- WordPress site owners sharing analytics, survey results, or research.
- Bloggers and content creators publishing data-driven articles.
- Marketing teams creating performance summaries and comparisons.
- Agencies designing dashboards and client-facing visual reports.
- Small businesses presenting operational or sales trends.
- Teams building knowledge-base content that benefits from visual explanation.