Graphical Dashboard Widgets 1.7.1

Description
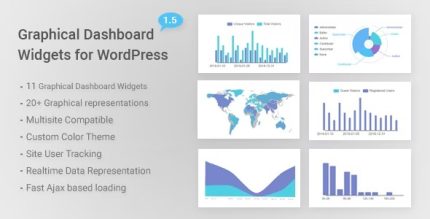
Graphical Dashboard Widgets is a WordPress plugin collection that adds dashboard widgets to help you track site activity using charts and graphs. Instead of digging through menus, you can view real-time data at a glance right in the WordPress admin dashboard. This makes it easier to understand performance trends quickly and support more accurate decisions. The graphical format improves readability for non-technical stakeholders, while the widget-based setup keeps monitoring organized within your existing dashboard workflow.
With a wide range of dashboard widget options, this plugin supports a clear, polished way to review key information visually as it updates in real time. It’s designed for straightforward integration into WordPress, so you can start monitoring without changing your site’s core setup.
Main Features
- Dashboard widget collection — Provides multiple widgets to display site information inside the WordPress admin area.
- Real-time site data — Widgets show data that updates in real time to reflect current performance.
- Graphical charts and graphs — Converts metrics into visual charts for faster comprehension.
- Wide range of widget options — Offers different dashboard widgets so you can choose what to monitor.
- At-a-glance monitoring — Displays information in a dashboard-friendly layout to reduce time spent searching.
- WordPress dashboard integration — Fits into the standard WordPress admin dashboard workflow.
- Polished, readable interface — Uses clear graphical elements to improve scanability of metrics.
Benefits
- Faster decision-making — Real-time charts reduce the time needed to interpret site performance.
- Improved data clarity — Graphs make trends easier to spot than raw numbers alone.
- Better monitoring workflow — Widget placement keeps key insights visible during daily admin tasks.
- More accurate assessment — Updated visual data helps you respond to changes with higher confidence.
- Accessible insights — Clear visuals support teams and stakeholders who prefer summarized reporting.
Who is it suitable for?
- WordPress site owners who want dashboard visibility into performance
- WooCommerce store administrators tracking activity through visual widgets
- Marketing teams reviewing site trends without manual data digging
- Web agencies managing multiple WordPress client dashboards
- Content sites that need quick operational awareness for ongoing publishing
- Site operators who prefer clear charts and graphs for reporting